Even the Linux kernel – one of the most battle-tested pieces of software on the planet – is not immune to crashes. A third-party driver with insufficient testing, a subtle race condition in a client BSP, or a bug lurking in a subsystem you did not write can all bring the system down without warning. When that happens, the most valuable thing you can have is a record of what the kernel was doing in its final moments. The problem is that a crash typically wipes the kernel ring buffer along with everything else.
This is the problem that pstore (Persistent Storage) solves. Working on an embedded industrial product for one of our clients, LABCSMART implemented pstore to capture kernel oops and panic traces in a reserved RAM region that survives the reboot, making those logs available for analysis immediately after the board comes back up. This article walks through the full setup: kernel configuration, device tree reservation, live testing, user-space message logging, and persistent ftrace function tracing.
Table of Contents
- Configuring the Linux kernel for pstore
- Adapting the device tree
- Pstore live tests
- User message log test
- Persistent function tracing
- Conclusion
Configuring the Linux kernel for pstore
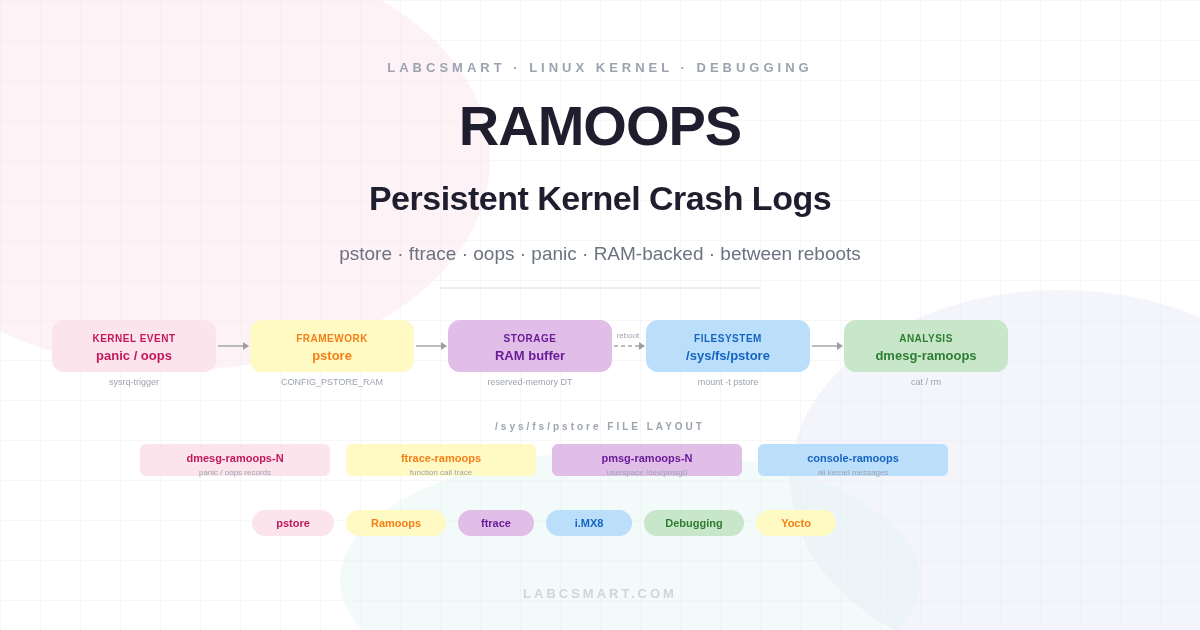
Pstore provides a framework for preserving kernel-related logs across system reboots. The kernel version used in this article is v5.4.Y, where the only available storage backend is RAM — which is why this variant is often referred to simply as Ramoops. Because the backing store is volatile, saved records must be moved off the device periodically (for example, by a systemd service that runs on every boot) to free space for the next crash.
The minimal set of kernel options required is:
CONFIG_PSTORE_RAM=y
CONFIG_FTRACE=y
CONFIG_FUNCTION_TRACER=y
CONFIG_PSTORE_FTRACE=y
Here is what each option does:
CONFIG_PSTORE— the umbrella option that enables the pstore subsystem. It is pulled in automatically by the options below.CONFIG_PSTORE_RAM— enables the RAM-backed storage backend. Panic and oops messages are written to a circular buffer in a reserved memory region, where they survive a warm reboot.CONFIG_FTRACE— enables the Linux kernel tracer. Required to unlock the next option.CONFIG_FUNCTION_TRACER— adds per-function call instrumentation and makesCONFIG_PSTORE_FTRACEselectable.CONFIG_PSTORE_FTRACE— records function call traces into the persistent RAM buffer. After a reboot, the captured trace is available at/sys/fs/pstore/ftrace-ramoops, showing exactly which kernel functions were executing in the moments before the crash.
Two additional options are worth knowing about, even if they were not enabled in our deployment:
CONFIG_PSTORE_CONSOLE— stores all kernel messages to the persistent buffer, not just oops and panics. Useful on systems where you want a full console log regardless of whether a crash occurred.CONFIG_PSTORE_PMSG— exports/dev/pmsg0, a character device that user-space applications can write to. Messages written there are appended to the pstore buffer and appear as/sys/fs/pstore/pmsg-ramoops-[ID]after reboot — handy for correlating application-level events with kernel crashes.
Starting from kernel 5.8, a block device can be used as the pstore backing store instead of RAM, via CONFIG_PSTORE_BLK. This opens the door to much larger dump buffers on systems that have eMMC or NAND, at the cost of a slightly more complex configuration. See the upstream documentation for details on CONFIG_PSTORE_BLK_BLKDEV, CONFIG_PSTORE_BLK_KMSG_SIZE, and CONFIG_PSTORE_BLK_MAX_REASON.
Adapting the device tree
Ramoops cannot simply borrow any free RAM — it needs an explicitly reserved region that the kernel memory allocator will not touch. The cleanest way to declare this reservation on an embedded platform is through a reserved-memory node in the device tree. The node describes the physical base address, the total region size, and how that region is subdivided into individual record types.
The key properties are:
reg— the base address and total size of the reservation. The size is rounded down to a power of two internally.record-size— maximum size per panic/oops dump record. Eachdmesg-ramoops-Nfile will be at most this large.console-size— maximum size per console output record. Console data is stored continuously, not only on crashes.pmsg-size— maximum size per user-space message record written via/dev/pmsg0.
Here is the complete device tree node used on our i.MX8MM platform, reserving 1 MB starting at physical address 0x880000000:
reserved-memory {
    #address-cells = <2>;
    #size-cells = <2>;
    range;

    ramoops@880000000 {
        #address-cells = <2>;
        #size-cells = <2>;
        compatible = "ramoops";
        reg = <0x00000008 0x80000000 0x0 0x100000>; /* 1MB from 0x880000000 */
        record-size = <0x8000>;  /* 32kB per record */
        console-size = <0x8000>; /* 32kB for console output */
        pmsg-size = <0x1000>;    /* 4kB for user messages */
    };
};
The 1 MB total budget is divided as follows: up to 32 kB per crash record (allowing multiple sequential panics to be stored independently), 32 kB for continuous console output, and 4 kB for user-space messages. Once a record slot is full, the next crash overwrites the oldest slot in circular fashion.
Alternatively, ramoops can be configured entirely via module parameters without touching the device tree. Look under /sys/module/pstore/parameters/ and /sys/module/ramoops/parameters/ to see the available knobs — useful for quick experiments on a running system without a rebuild cycle.
Pstore live tests
Before triggering any crash, mount the pstore filesystem so the kernel knows where to expose the captured records:
root@imx8mmevk-labcsmart:~# mount -t pstore pstore /sys/fs/pstore
On production images it is worth adding this mount to /etc/fstab or a systemd mount unit so it is always available at boot without manual intervention. Once mounted, any previously captured oops or panic will immediately appear as dmesg-ramoops-N files, where N is the record slot index.
To confirm the mechanism works end-to-end, we deliberately trigger a kernel panic using the sysrq interface. On the target system, the reboot-on-panic timeout was configured to 5 seconds, so the board resets automatically:
root@imx8mmevk-labcsmart:~# echo c > /proc/sysrq-trigger
If your system is not set to reboot automatically on panic, press the hardware reset button after the crash. After the board comes back up and you remount pstore, a new dmesg-ramoops-0 file will be waiting:
root@imx8mmevk-labcsmart:~# cat /sys/fs/pstore/dmesg-ramoops-0
Panic#1 Part1
<6>[    0.000000] Booting Linux on physical CPU 0x0000000000 [0x410fd034]
<5>[    0.000000] Linux version 5.4.154-5.5.0-devel+git.9f04e0d3d560 (oe-user@oe-host) (gcc version 9.3.0 (GCC)) #1 SMP PREEMPT Fri Nov 26 15:33:03 UTC 2021
[...]

<6>[   33.763199] REG_3P3V: disabling
<6>[   33.763208] REG_MIPI_PHY: disabling
<6>[   33.763215] V3.3_SD: disabling
<6>[  238.779510] sysrq: Trigger a crash
<0>[  238.783033] Kernel panic - not syncing: sysrq triggered crash
<4>[  238.788803] CPU: 0 PID: 1602 Comm: sh Not tainted 5.4.154-5.5.0-devel+git.9f04e0d3d560 #1
<4>[  238.796994] Hardware name: NXP i.MX8MMini LPDDR4 EVK board
<4>[  238.805095] Call trace:
<4>[  238.807556]  dump_backtrace+0x0/0x148
<4>[  238.811228]  show_stack+0x24/0x30
<4>[  238.814555]  dump_stack+0xb4/0x110
<4>[  238.817969]  panic+0x160/0x368
<4>[  238.821037]  sysrq_handle_reboot+0x0/0x28
<4>[  238.825054]  __handle_sysrq+0x90/0x188
<4>[  238.828809]  write_sysrq_trigger+0x98/0xb8
<4>[  238.832912]  proc_reg_write+0x8c/0xe0
<4>[  238.836582]  __vfs_write+0x48/0x90
<4>[  238.839990]  vfs_write+0xe4/0x1c8
<4>[  238.843310]  ksys_write+0x78/0x100
<4>[  238.846720]  __arm64_sys_write+0x24/0x30
<4>[  238.850657]  el0_svc_common.constprop.0+0x74/0x180
<4>[  238.855460]  el0_svc_handler+0x34/0xa0
<4>[  238.859223]  el0_svc+0x8/0x208
<2>[  238.862294] SMP: stopping secondary CPUs
<0>[  238.866231] Kernel Offset: disabled
<0>[  238.869727] CPU features: 0x0002,2000200c
<0>[  238.873742] Memory Limit: none
root@imx8mmevk-labcsmart:~#
The dump starts with a full dmesg from boot through to the point of the crash, giving you complete context: what was initialised, what was running, and the full call stack at the moment of the panic. Each subsequent crash increments the record index (dmesg-ramoops-1, dmesg-ramoops-2, and so on) until the reserved region is full, at which point the oldest record is overwritten. To explicitly free a slot and reclaim its space, simply remove the file — the pstore backend will mark that slot as available immediately:
root@imx8mmevk-labcsmart:~# rm /sys/fs/pstore/dmesg-ramoops-0
User message log test
When CONFIG_PSTORE_PMSG is enabled, the kernel exposes /dev/pmsg0 as a simple append-only character device. Any process with write permission can push messages into the persistent buffer — the data survives a reboot and appears as pmsg-ramoops-0 in the pstore filesystem. This is particularly useful for correlating application-level events (service start, configuration applied, update triggered) with a crash that follows shortly after.
A minimal example: we write a message, reboot, and verify it is still there:
root@imx8mmevk-labcsmart:~# echo "Hello world" > /dev/pmsg0
root@imx8mmevk-labcsmart:~# reboot
After the reboot, the message is still there:
root@imx8mmevk-labcsmart:~# mount -t pstore pstore /sys/fs/pstore
root@imx8mmevk-labcsmart:~# cat /sys/fs/pstore/pmsg-ramoops-0
Hello world
In a real deployment, a watchdog service might write a heartbeat timestamp to /dev/pmsg0 every few seconds. After an unexpected reboot, the timestamp in pmsg-ramoops-0 tells you exactly when the system last wrote to it, giving you a tight upper bound on how long before the crash the service was still healthy.
Persistent function tracing
A panic message and call stack tell you where the kernel died. Persistent ftrace goes further: it tells you how the kernel got there, capturing the sequence of function calls leading up to the crash. This is especially valuable for hardware-related hangs where no oops is generated — the ftrace record shows the last known execution path before the system stopped responding.
Ftrace recording into the pstore buffer is controlled by a single debugfs knob. If debugfs is not already mounted, mount it first:
root@imx8mmevk-labcsmart:~# mount -t debugfs debugfs /sys/kernel/debug/
Then enable persistent ftrace recording:
root@imx8mmevk-labcsmart:~# echo 1 > /sys/kernel/debug/pstore/record_ftrace
After the next reboot, the pstore filesystem will contain an additional ftrace-ramoops file alongside the crash dumps:
root@imx8mmevk-labcsmart:~# ls /sys/fs/pstore/
dmesg-ramoops-0 dmesg-ramoops-1 ftrace-ramoops pmesg-ramoops-0
Unlike the numbered crash records, ftrace-ramoops has no index suffix. Its content is appended continuously and rotates when the allocated record size is reached. Reading it reveals the low-level function call chain captured just before the crash:
root@imx8mmevk-labcsmart:~# cat /sys/fs/pstore/ftrace-ramoops
0 c08bf830  c08bfbf0  do_page_fault.part.8 <- do_page_fault+0x3c/0xa8
0 c001b770  c08bfb48  fixup_exception <- do_page_fault.part.8+0x32c/0x398
0 c0045bb0  c001b780  search_exception_tables <- fixup_exception+0x20/0x38
0 c008914c  c0045bd8  search_module_extables <- search_exception_tables+0x38/0x44
0 c08bff5c  c008915c  add_preempt_count <- search_module_extables+0x24/0xc0
0 c08bfe78  c00891cc  sub_preempt_count <- search_module_extables+0x94/0xc0
0 c08b2e28  c08bfb64  __do_kernel_fault.part.7 <- do_page_fault.part.8+0x348/0x398
Each line shows the caller address, the callee address, and the human-readable function name with its offset. In the trace above, the chain leads into do_page_fault — the signature of a NULL pointer dereference or an access to an unmapped region. On a real bug this trace pinpoints the exact execution path through driver and subsystem code, dramatically reducing the time needed to identify root cause.
Conclusion
Pstore with the Ramoops backend is one of the most cost-effective debugging tools available on embedded Linux: no external hardware required, no host connection needed, and the information it preserves — a full dmesg from boot to crash, a function-level execution trace, and optional user-space annotations — is often enough to identify a bug without ever being able to reproduce it on demand. For production deployments on constrained hardware where a block device backend is not available, RAM-backed pstore is the right default choice.
The combination of dmesg-ramoops-N for the panic log, ftrace-ramoops for the call chain, and pmsg-ramoops-N for application-level annotations gives you three independent perspectives on every crash — and together they usually tell the full story.
What method do you use to capture kernel logs before the system gives its last breath? Share in the comments.